Since the release of SQL Server 2014 you can find several articles and blog posts about the changes in the new redesigned cardinality estimator. An excellent and detailed guide about the changes in the new CE you can find in the white paper Optimizing Your Query Plans with the SQL Server 2014 Cardinality Estimator. Almost all of them describe changes related to cardinality estimation process for queries with multiple predicates, some of them with details about exponential back-off algorithm implementation. This is an important change, the change in the CE assumption set, but very rare it will lead the new CE to use an execution plan different than the one with the old CE. Estimations done with the new CE are higher than before SQL Server 2014, but they are usually not different more than one order of magnitude.
The most important and significantly (sometimes dramatically) different estimations you can find in queries with predicates referring to the values which are out of statistics histogram. The old CE estimates 1 in this case, the new CE comes with significantly different values. In the mentioned white paper and some posts and presentations you can find the statement that the new CE comes with better estimations (since we already know that the old CE’s estimation of 1 is often wrong), but I would use the word different instead of better. In the next few posts I will try to explain why.
In this article I will describe a funny bug with a query with a predicate which refers to the values which are not in the range covered by the appropriate statistics histogram. The regression is significant; however, the data distribution and query pattern are so rare and strange, that I have used the word “funny” in the bug description.
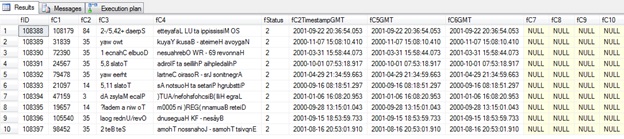
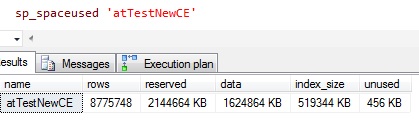
First let me introduce my sample table named atTestNewCE. The size is about 1.5 GB, it has 8.7 Mio rows. Here are few of them:
The table has an index on the columns fStatus and fC1 and the appropriate statistics is up-to-date. Here are statistic details:

You can immediately see a strange thing. The column fStatus has value 2 for all rows. This is strange and very rare, but as you can see, it exists and in a large company you can regularly find unusual data distributions and strange queries in the system.
OK, where is the problem with this column? Let’s imagine that we need to do something with rows which has values 1 or 3 in this column. We’ll write a query to extract these rows. And we’ll write it twice to execute it with the old and new CE. Since my test database is in 120 compatibility mode I will use TF 9481 to simulate the old CE behavior. Here are the queries:
SELECT fC1, fC2TimestampGMT

FROM atTestNewCE

WHERE fStatus IN (1,3) ORDER BY fC1 OPTION(QUERYTRACEON 9481);
SELECT fC1, fC2TimestampGMT

FROM atTestNewCE

WHERE fStatus IN (1,3) ORDER BY fC1;
And we are, of course, curious to see the execution plans. We have an index on the predicate column, the query is very selective, so, what we expect here is a Nested Loop Join plan with the Sort operator, but with a very small Memory Grant. Let’s see if CEs meet our expectations:
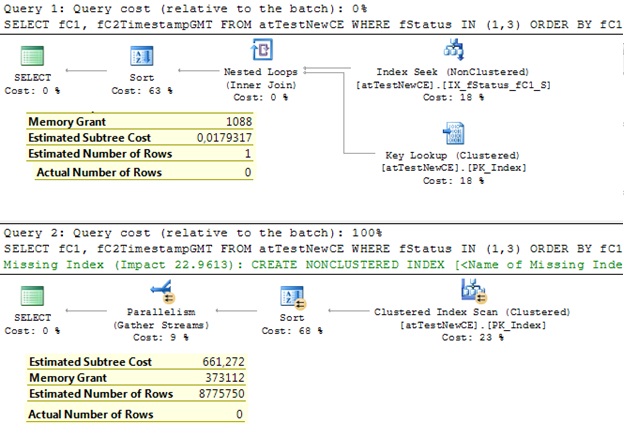
Well, isn’t that interesting? The old CE with the estimation 1 and the new CE with the table cardinality! And both of them know (stats is up-to-date) that there are no rows meet the predicate criteria.
What’s difference? The old CE believes that the statistics is up-to-date; while the new CE expects that the statistics is always out-of-date and always expects something out of statistics histogram. The assumption that the statistics is out-of-date is realistic and this change in the new CE is not wrong conceptually. You should not expect 1 row (even in this specific case, this estimation would be almost correct, the correct is 0), but 8.7 Mio rows definitely not!
Of course, with so different estimations we end up with different plans and significant Memory Grant overestimations in the case of new CE.
Workaround
As mentioned this query pattern and data distribution are not so frequent, but I will anyway show you a workaround. This workaround is at the same time an argument why I think that the described behavior is not a different assumption, but a bug.
When you write the expression A IN (1, 2) the query engine rewrites it to an equivalent form: A = 1 OR A = 2. It seems that the new CE has troubles with expressions having the OR operator (see my previous posts). If you would, however, use UNION ALL and rewrite the query:
SELECT fC1, fC2TimestampGMT

FROM atTestNewCE

WHERE fStatus = 1

UNION ALL

SELECT fC1, fC2TimestampGMT

FROM atTestNewCE

WHERE fStatus = 3

ORDER BY fC1;
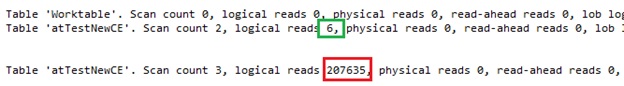
The execution plan and details looks OK:
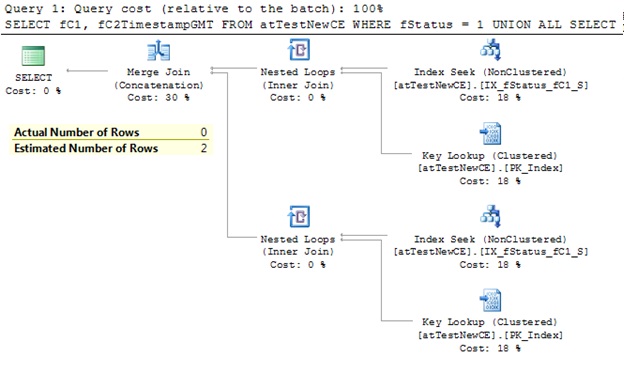
So, it seems again improper handling of OR operator.
This is an issue ONLY if the stats histogram contains only one element! As soon as the second entry comes into the histogram (regardless of uneven data distribution) both CEs come with the same estimations. Strange again, but at the same time it’s good, since it significantly reduce the surface for potential regressions.
Conclusion
This is an introduction article to changes between new and old CE regarding the values which are out of statistics histogram. These are the most significant differences with potential significant execution regressions. In the next few articles I will describe in details problems related to Key Ascending columns in large tables in both SQL Server 2012 and 2014, where the old and new CE come with significantly different estimations leading to different execution details.
Thanks for reading.