SQL Server 2019 provides another option to deal with the last-page insert contention – OPTIMIZE_FOR_SEQUENTIAL_KEY. It improves throughput for high-concurrency inserts into an ascending clustered index. Unlike the solutions dealing with hash keys, partitioning or reverse indexing, this one does not change the nature of the clustered key – it remains ascending – and thus it does not affect business logic at all.
To get exhaustive information about this feature (motivation and implementation details), I would recommend the excellent article Behind the Scenes on OPTIMIZE_FOR_SEQUENTIAL_KEY, written by Pam Lahoud, Program Manager with SQL Server Engineering Team. In this post, I will share with you some very exciting (and surprising) test results.
I used the following code to create and populate sample tables and create procedures. To compare the execution times for the INSERT statements, I used Query Store with the default settings, except for the INTERVAL_LENGTH_MINUTES attribute – just to easily compare the runtime stats.
ALTER DATABASE OptSeqKey SET QUERY_STORE =ON (INTERVAL_LENGTH_MINUTES = 5);
To produce a last page contention friendly workload, I used the ostress tool. I ran the following commands with about 5 minutes interval distance. By taking this approach, I can easily analyze wait stats – all entries I’ll find there belongs to a specific testing scenario. Here are my test scenarios:
- First test: calling the P1 stored procedure that performs 50 inserts into a “normal, non-optimized” disk table with an ascending clustered key with 300 parallel sessions.
.\ostress -E -dOptSeqKey -Q"EXEC dbo.P1" -SMySQL2019Server -r100 -n300 -q
- Second test: calling the P2 stored procedure that performs 50 inserts into a table optimized for sequential key, with an ascending clustered key with 300 parallel sessions.
.\ostress -E -dOptSeqKey -Q"EXEC dbo.P2" -SMySQL2019Server -r100 -n300 -q
Third test: calling the P3 stored procedure that performs 50 inserts into each of the two tables, with 300 parallel sessions.
.\ostress -E -dOptSeqKey -Q"EXEC dbo.P3" -SMySQL2019Server -r100 -n300 -q
That means, the first test inserts 1.5M rows into the normal table, the second 1.5M rows into the optimized table, while the third inserts 3M rows (1.5M rows in each table). Now, the exciting part – results.
In my Query Store, the plan with the plan_id of 1 inserted a row into the normal table, the plan with the id of 5 was used to insert into the optimized table. The following query returns the average execution time for two inserts statements:
SELECT plan_id, runtime_stats_interval_id, count_executions, CAST(avg_duration AS INT) avg_duration

FROM sys.query_store_runtime_stats WHERE plan_id IN (1, 5) ORDER BY runtime_stats_interval_id, plan_id;

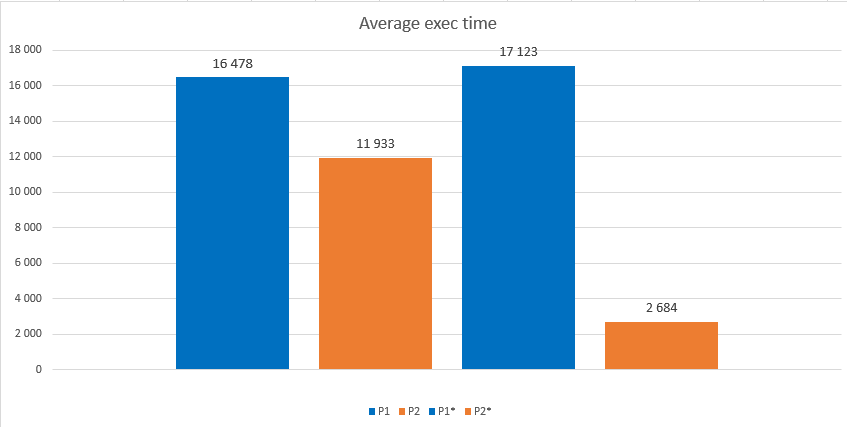
And here are results in chart format:

As you see, the average execution time for a single INSERT (the first blue bar, 16.5 ms) is very high with 300 parallel sessions, I definitely hit the contention. When I ran the same workload against the table with the OPTIMIZE_FOR_SEQUENTIAL_KEY turned to ON, the throughput looks better – the average execution time (the first orange bar) is reduced about 28%. This is what we expected (from Microsoft documentation), and it shows that this feature helps, with contention convoys.
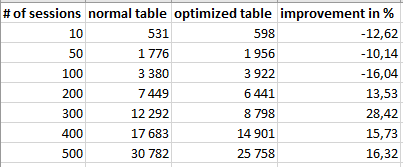
I tested it also with different number of parallel sessions, and here are results of one my tests in tabular and chart format:


The results show that the feature should be used for tables, where latch convoys already happen or are about to happen. In a not-so-heavy workloads, it brings a small overhead. You can see that inserts with 100 parallel sessions are 16% slower for a table with the optimized sequential key. However, when you hit the convoy, the feature definitely helps.
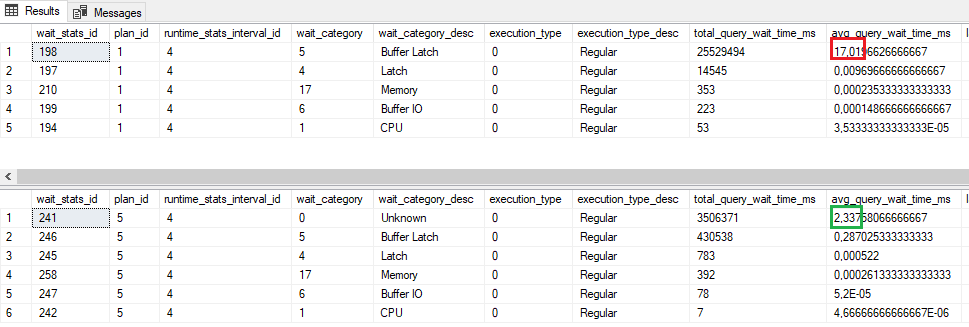
Let’s analyze now waits captured by Query Store. The following figure shows waits for the first two tests, respectively:

As we assumed, we hit the convoy; the wait stats shows clearly that inserts into a normal table were waiting for resources from the Buffer Latch category. From the lower part of the figure, we can find out that the BTREE_INSERT_FLOW_CONTROL wait type seems to be categorized as Unknown. Nevertheless, the overall results are better.
All mentioned results and numbers are more-less expected. What I definitely did not expect are significant improvements for inserts into the optimized table in my third test, where I executed both procedures. With this tests, inserts into a normal table behaved similar to the first test, where we inserted in the normal table only (16.5 ms vs. 17.1ms). However, inserts into the optimized table were significantly faster – the orange bar is 6x smaller than the blue one (11.9ms vs. 2.7ms)! When we compare the average execution time for the insert with the initial execution time for non-optimized table, we see an incredible throughput improvement of 84%!
When we look into the Query Store, we can see that BTREE_INSERT_FLOW_CONTROL is significantly reduced compared to the case where we ran only optimized inserts:

EDIT:
It seems I was too excited about the feature and wanted to believe that in a mixed contention workload, the code that deals with latch convoys in the optimized for sequential key table somehow interferes with the poor latch contention in a non-optimized table. However, the numbers in the third tests were too good to be fully true. The numbers are correct, but in the 3rd test, where both inserts are invoked, the insert in the normal table introduces a delay to the second call, therefore reduces the frequency of the incoming calls that insert into the optimized table (as the opt_for_seq_key does for the incoming threads). The exec time for the second INSERT dropped because the incoming calls are slowed down, and this time is, of course, not taken in these numbers.
However, all my tests with 200+ parallel sessions on the 8-core machine for different tables clearly show that inserts into a table with the optimized key are 20-30% faster.
Thanks for reading!


