
In this article I will explore changes in new CE related to column correlation. As mentioned in my first article about new CE, this change is announced in the paper Testing Cardinality Estimation Models in SQL Server.
For this article we will query the table Person.Person from the AdventureWorks2012 database. At the beginning let’s execute four queries with a single column predicate to find out the cardinality estimation for only one predicate.
SELECT * FROM Person.Person WHERE LastName LIKE N'S%';

--Estimated # Rows: 2131.4 Actual # Rows: 2130

SELECT * FROM Person.Person WHERE EmailPromotion = 1;

--Estimated # Rows: 5114.26 Actual # Rows: 5044

SELECT * FROM Person.Person WHERE PersonType = 'IN';

--Estimated # Rows: 18590.6 Actual # Rows: 18484

SELECT * FROM Person.Person WHERE Title = 'Mr.';

--Estimated # Rows: 612.573 Actual # Rows: 577
Total number of rows in the Person table is 19972.
Both CEs deliver the same estimations for single column predicates. Let’s see what happen when we combine them.
Two Predicates
As first query we will combine first two predicates and execute the query with old and new CE:
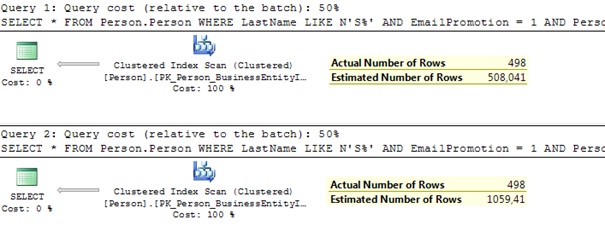
SELECT * FROM Person.Person WHERE LastName LIKE N'S%' AND EmailPromotion = 1 OPTION (QUERYTRACEON 9481); --old CE

SELECT * FROM Person.Person WHERE LastName LIKE N'S%' AND EmailPromotion = 1;--new CE
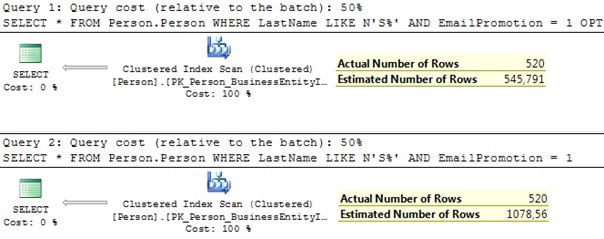
We can see that new CE has almost doubled the estimated number of rows. Let’s see how we get both values.
Let’s define selectivity S as cardinality of a single column (estimated number of rows for a single column predicate) (C) divided by total number of rows in the table (R).

The old CE assumes that in one relation values from distinct columns are independent – there is no correlation between multiple columns at all. Therefore the cardinality of the query can be calculated with the following formula:
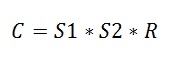
where S1 is the selectivity of the predicate with lower selectivity, S2 the selectivity of the predicate with higher selectivity and R total number of rows in the table.
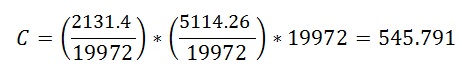
Let’s apply this formula to our query:
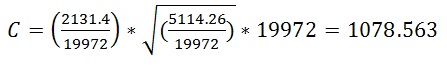
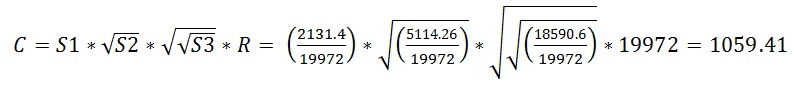
This assumption is changed in new CE. According to the SQL Server team for most customer workloads values in distinct columns in the same table are slightly correlated. Therefore new CE assumes some correlation between columns and the estimated number of values can be calculated by using the following formula:
![]()
When we use this formula for our query we will get the estimated number of rows for new CE shown in the above figure:
Three Predicates
Let’s extend our query with third column:
SELECT * FROM Person.Person WHERE LastName LIKE N'S%' AND EmailPromotion = 1 AND PersonType='IN' OPTION (QUERYTRACEON 9481);--old CE

SELECT * FROM Person.Person WHERE LastName LIKE N'S%' AND EmailPromotion = 1 AND PersonType='IN';--new CE
Let’s look at the execution plan end estimation details:
Clear, similar to two column predicates, new CE comes up with more rows. Let’s apply formulas. First for old CE:

And then for new CE:
Analog to the two predicate example S1 is selectivity of the predicate with lowest selectivity and S3 is selectivity of the predicate with highest selectivity.
N Predicates
Now we will create a general formula which covers n predicates.
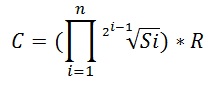
where Si is selectivity of a single column and selectivities are ordered by their value: So is the lowest selectivity, Sn is the highest selectivity of a single column in a query with n predicates.
So, in new CE values in distinct columns are not indenpendent as they was in old CE, they are slightly correlated and their correlation is implemented with exponential backoff algorithm.
What is now better: old or new CE?
Well, as you expect, the answer is unpopular one – it depends. In our examples here, the estimations made by the old CE are closer to actual number of rows, since values in the columns we used are not correlated. Therefore the old assumption about indenpendency is more appropriate in this case as new one. Why the SQL Server team has changed it? Because under new assumption estimations should be better for most of workloads for most of customers. Of course, you could easily find an example where old CE comes up with better estimation (as in our case) but also cases where estimations based on new assumptions are closer to reality. Microsoft must care about all customers and their workloads, for you is only your workload important and you have to test intensive your workload to find out if execution plans generated by new SQL Server version are at least good as your existing plans.
Correlated Columns
Let’s take now an example with correlated columns. As we already know the old CE assumes that columns are independent, therefore estimations are far away from the actual values. Let’s find out if new CE significantly improves estimations.
Our sample database is again the AdventureWorks2012 but this time we’ll use SalesOrderHeader table. We want to combine values from the columns OrderDate and DueDate. Values in these columns are fully correlated (DueDate is either 12 or 13 days after OrderDate). Let’s see the estimations for queries with these two columns with old and new CE:
SELECT SalesOrderID,OrderDate, DueDate, SubTotal

FROM Sales.SalesOrderHeader

WHERE OrderDate BETWEEN '20070901' AND '20071001' AND DueDate BETWEEN '20070913' AND '20071013' OPTION (QUERYTRACEON 9481);--old CE
SELECT SalesOrderID,OrderDate, DueDate, SubTotal
FROM Sales.SalesOrderHeader
WHERE OrderDate BETWEEN ‘20070901’ AND ‘20071001’ AND DueDate BETWEEN ‘20070913’ AND ‘20071013’;–new CE
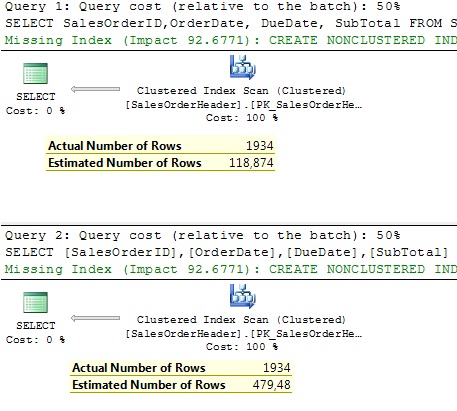
As we see in the above Figure the Estimated Number of Rows under new CE is better, but it is still far away from the Actual Number of Rows. That’s because the columns are little bit correlated and our columns are fully correlated. How can we suggest the optimizer that our columns are correlated and that new assumption is not good enough? Trace flag, of course J. TF 9471. Let’s see:
SELECT SalesOrderID,OrderDate, DueDate, SubTotal

FROM Sales.SalesOrderHeader

WHERE OrderDate BETWEEN '20070901' AND '20071001' AND DueDate BETWEEN '20070913' AND '20071013' OPTION (QUERYTRACEON 9471); --new CE
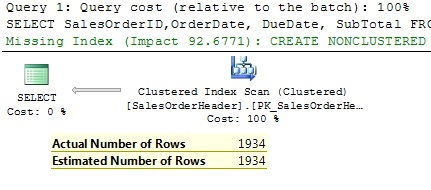
Perfect estimation! By using TF 9471 instead of calculations based on exponential backoff algorithm the optimizer simply takes the single column cardinality for predicate with lower selectivity. In this case both have the same cardinality- 1934 and this is the final estimation.
Conclusion
The independency assumption has been removed from new cardinality estimator. In new CE values in distinct columns are slightly correlated. The correlation is represented by exponential backoff algorithm. This new assumption should be more appropriate for most of workloads for most of customers. You need to perform intensive testing of your workload to find out if this new assumption is also better for you (or at least does not regress your plans).
To instruct the optimizer that columns in a query are fully correlated in new CE you can use trace flag 9471. Instead of calculations based on exponential backoff algorithm this trace flag instructs the optimizer to take single column cardinality for predicate with lower selectivity as final estimation.

[…] week I have got a question regarding my post New Cardinality Estimator Part 4 – Single Table and Multiple Predicates. The question was about possibilities to affect the estimation with multiple predicates done by new […]
Hi Milos,
I believe you might want to correct this line.
“Analog to the two predicate example S1 is selectivity of the predicate with lowest selectivity and S3 is selectivity of the predicate with highest selectivity.”
S1 is the one with highest selectivity and S3 is with the lowest selectivity
and the calculation also proves it 2131.4/11972 < 18590.6/11972.
The lesser the value ,the more selective it is.